Thursday, April 17, 2014

Final Project: The Puzzle of a Works-Like Model

Today, my partner Christina and I worked on creating a mock-up of what we wanted our final project to work like. Using Legos, foam board, a breadboard and bulbs from the Physics Lab, we managed to created a miniature of the energy bike set up. All the bulbs we attached in series, so that as each switch was flipped, they would become a little dimmer as the resistance increased. Because we did not have access to a generator, we improvised a 9 volt battery. Our Lego bike and chain configuration represents the user and how the bike motion will provide power to the generator, which in turn will provide current to the circuit.

Works-Like Model Energy Bike
 Our model includes an (optional) outlet. If we have time before the due date, we have thought about adding an appliance option, so that the user could see how much power a basic piece of technology, like a hairdryer, requires to run.

Energy Bike Circuit Diagram (Iteration 3)
Our circuit puts the two types of bulb (incandescent and fluorescent) in series, but each series is then connected in parallel, such that all eight can be on at once without more effort than it takes to power one series.

Our Completed Circuit Based on Iteration 3
For this model, the switches were required to be on the breadboard, which is attached to the back of the foam-board. However, if we use switches in our final version, they will either have to be on the front where another user could manually activate them on on the handlebars of the bike so a single user could operate the entire display without dismounting. To avoid the user having to do anything, we could simply user a timer-program to turn on the lights at different points. This way, the user would only have to focus on pedaling and overcoming the steadily increasing resistance.

We ended up having to recreate our entire circuit from our original design (see previous post) because the parallel set up would not increase the resistance as more bulbs were added to the system. Fail fast and frequently...

Once the circuit was built, we had to test it to be sure it worked to our specifications.


To our great relief, the circuit worked perfectly. Each time a new bulb was added to the circuit via a switch, the previous bulb(s) became slightly dimmer. Though we can not directly experience it on this model, the increased resistance will be evident to the user on the cyclist. They will have to pedal harder in order to keep the bulbs (mostly, the incandescent ones) lit.

Stand-In with Functioning Gear Train

Overall, our model represents what we expect to happen during our final demonstration. Though we did not have access to a generator, our Lego stand-in's gear chain does work, and can visually simulate the task. As we built our model, and found we had trouble doing so, we realized just how difficult this project is going to be.

In the first place, we will need to calculate what kind of generator and bulbs we will want. All this will depend on the range of the user's pedaling ability. We do not want bulbs that cannot be powered by the generator, or worse, bulbs that burn out to easily. Safety is also a concern. The generator could overheat, or the bulbs could become very hot, or even the circuit board could reach dangerous temperatures. This project will require careful wiring and calculations prior to experimentation. However, while the bulbs can easily be tested until a usable combination is found, the generator is a one time shot. We cannot simply buy a bunch of generators or motors to test at random: that would consume our entire budget. To solve the issue of the varied/too little/ too much current, we may have to include an inverter on our list of supplies. Beyond the initial set-up and look, what our mock-up really demonstrates is just how tedious and detail-oriented our road to the final product is going to be.

Monday, April 14, 2014

Final Project: The Puzzle of Testing Critical Elements...

Today in class, mt final project partner Christina and I worked on developing our pedal powered light board, as well as testing our a circuit that could potentially power it.

Our project will require mostly custom -made parts, but the circuits and light will be the most difficult aspect.

We stared by designing two options for our circuit. One incorporates user activated switches to add more bulbs to the circuit, the other uses an Arduino program to time when the lights are added to the circuit.


 Design 1 used switches, which the user would have to manually flip in order to add more bulbs to the circuit. Wells within the circuit would allow the current to flow from point A to B no matter how many bulbs were activated, not what their configuration to each other was.

Design 2 used Arduino programming instead of manual switches to add bulbs to the circuit. This was the user could focus on pedaling and physically observing the difference in resistance as the amount of bulbs (and type) in the circuit changed.

Finally, to test this configuration, we assembled a mock circuit using the Design 1 schematic (to an extent) using a 9 volt battery, five 270 ohm resistors and five LEDs to test the switches and configuration. Our mock up did not include a well,  so the negative end of the 9 volt battery served that purpose.


The mock up worked exactly as planned, and the LEDs could be lit up in any configuration simply by flipping the needed switches. This means that either Design for the circuit will work, so if we cannot make the Arduino program fit our needs in time, the switch design will work just as well.

Additionally, we spent part of our time gathering resources and researching previous Energy Bike designs.

Instructables:

Thursday, April 10, 2014

The Final Project Week One: The Puzzle of Going Out with a Bang.....

Today, we all received our final projects for the year. My partner Christina and I will be working towards her idea of creating a bicycle into an energy source. Plainly speaking, we have to turn mechanical energy into electrical energy. However, the potential (no pun intended) that this electricity creating bike has is unlimited. We could power anything, and it is hard to narrow the list down.

The idea itself is simple enough.....but the possibilities are endless.

We could...
Demonstrate the energy consumption differences between electric and traditional cars...

Heat a cup of water using pedal power...

Power a light board so people could see how difficult it is to generate energy and see how much they are capable of generating.....

Power a projector....that explains what they are doing on the bike.....

Power a heater to keep temperature in a fish tank constant.....

Power a hair-dryer so people could see how much energy everyday objects use.....

 Power a 9V Radio (we made these in Physics lab).....

Charge the users cell phone and see how much power different brands of phones require.....

Have people guess how much power objects consume and try to create it.....

Power a small fan using various gear ratios for resistance.....


Ultimately, our goal is to teach the future users about energy, energy consumption and the importance of conserving energy. By physically experiencing how difficult it is to generate energy into a usable form, the users will gain a new appreciation for it, as well as an understanding of how big a difference one small change can make. They will experience the energy through the bike itself as they pedal along, producing mechanical energy that turns into electrical energy. for mechanisms, we have a variety of options. The main one will be the bike gears. We will have to have a standard gear setting so that the only change in resistance comes from the change in energy requirements from the appliance it is powering. We will need to use either the pico cricket or an arduino based circuit board to help with the transformation from mechanical to electrical energy. Our exhibit's sensing and output will be pretty straight forward. For example, with the light-board idea, the system will have to measure the amount of power input, and light up a certain number of bulbs in reaction to it. For various other appliances, we will have to include a sensing mechanism that indicates when the user is getting close to the required energy input or has gone over, as for some appliances they will need to maintain a constant rate of pedaling to keep them working. Because it would not make sense to have our users randomly starting and stopping on the bike, we will have to incorporate proportional control to make the system respond in accordance with the energy input provided. The specific circuit board, wall covered in light-bulbs, flaps hiding answer to questions and any other hook-up requirements needed by any appliances we choose to power we will have to make ourselves. Fortunately, Christina knows a few people from the Energy Bike Project in Ohio who might be able to help us in our research.

http://www.ohioenergy.org/bike

Here we go.....

Thermal Systems Day Two: The Puzzle of MATLAB continues.....

Today, my partner Kirstin and I expanded our simulated behavior from the previous day to an actual thermal system, namely a resistor with a sensor attached to it. The sensor, called a thermistor, would measure the heat dissipated by the resistor, which we could control by altering the energy output of the system.

Our first experiment was to determine the physical constants (Rth and C) from our simulated heating experiment in order to conduct our experimental run.

Using:
Rth = (T-Tair)/p

And the knowledge that our maximum power was 6.5 volts.

(354.92 - 303.5)/6.5 = 7.9 T/W

And 
C= p/initial slope of graph

C = 6.5/ [(325.5-312.3)T/(54-10)s) = 21.6 W/(T/s)


Because (Rth)*(C) = ti, the time constant or time in which it would take our system to reach 63.2% of its final asymptotic value, we could check our answers.

(7.9)*(21.6) = 170.64

At this time in seconds, out graph was approximately two thirds the way to its final value, so we knew we were correct.

Our two calculated values were dramatically different from our simulated values in the previous post because of the dramatic change in power. Now, we only had a 6.5 v battery to power our system, so the answer had to adhere to this stipulation. 


Next, we modified our simulated heating program to incorporate these parameters. 

Our simulated heater evenly tapers off and maintains a constant temperature once it reaches the desired temperature. Additionally, the incline is smooth, whereas the experimentally measured incline was rougher. This is probably the result of slightly fluctuating surrounding air temperatures or wind.  However, just line the experimentally measured values, the temperature rises more sharply at the beginning and then gently tapers off to a smaller slope.
Next, Kirsten and I constructed a bang-bang controlled heater that would raised the temperature to the desired value and then try to keep it there. 

Bang-Bang control experimental script


Bang-bang control experimental graph


Unlike our simulated bang-bang control, the experimental graph did not fluctuate evenly on it reached the desired temperature. Instead, it bounced randomly to different values around the desired temperature based on the system was interacting with the air temperature around it. It behaved more like a realistic system should because it is a real system. Next, Kirsten and I implemented Proportional Control to help our system. To do this, we experimented with various proportional gains (.05, .2, and .5). We had to calculate the coefficients each time. To do this, we set up a proportionality ratio:

100 is to 6.5 as (blank) is to .05

Our calculated coefficients were:

.7679 for .05, 3.077 for .2, and 7.692 for .5

Finally, we inserted these values into our coefficients into the script to observe their effects.


.5 Gain

.2 Gain

.05 Gain

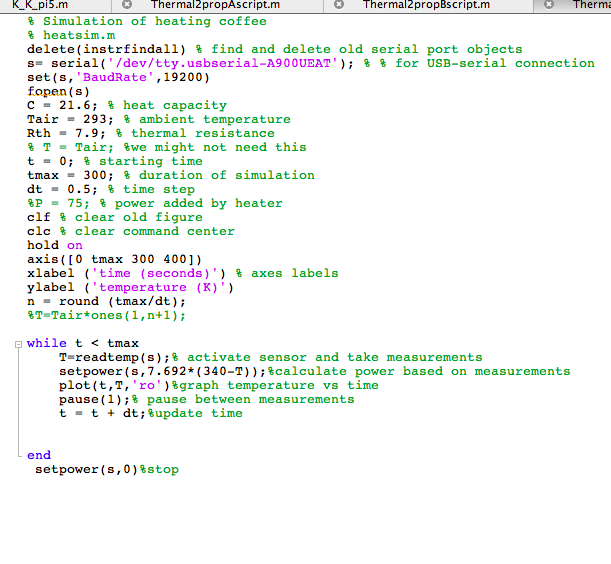
Our results were varied, but after ultimately the coefficient of 7.69 proved to be the best option for our realistic system.

Gain of .5, Coefficient 7.69


Gain of .2, Coefficient 3.077
Gain of .05, Coefficient .769
Ultimately, the experimental system never reached its target Temperature of 340 Kelvin. When the proportional gain is small, the system does not add enough power to reach its destination. Even when there is a large difference between the final and initial temperatures, the small coefficient results in a low power setting. Conversely, a large coefficient results in a much larger power setting. When Kp was almost 8, the system did come extremely close to reaching it's goal. 
Graph of Simulated Proportional Control
                              
Unlike our simulation, the experimental graphs never made it to 350 Kelvin, let alone exceed it.


Finally, we constructed our very own PI Controller. A Pi Controller incorporates both integral and proportional control to achieve and maintain a certain temperature. 

Script PI Controller
                              
Script PI Controller and Graphs of Temperature and Power vs Time
After a bit of experimentation, we found that the Ki value from the equation: 

P_desired = Kp*error+Ki*integral_error

Was approximately .5. However, we ended up having to increase our Kp value from 7.69 to 12 in order for the system to eventually reach its destination. The graph shows that, even when we blew on the resistor, thus cooling it, the temperature remained mostly constant while the power fluctuated heavily in order to maintain this constant temperature. Unlike our simulated PI Controller from the previous post, this controller did not fluctuate so dramatically or predictably. More often than not, as evidenced by the above red line on the upper graph, the temperature was constant, even under cooling conditions. 
Simulated PI Controller and Graph